Is measuring soil mineral nitrogen worthwhile?
29th March 2022Over 15 years ago The Arable Group, now part of NIAB TAG, reviewed the available recommendations systems for predicting the economic optimum dose of applied nitrogen for feed wheat.
This was done by reviewing and analysing their database of around 60 field trials. The trials were all carried out on long-term arable soils where there had not been a recent use of organic manures. Soil types varied from sandy loams to heavy clays and silts. No trials had been carried out on organic peat soils. All the main rotational positions of feed wheat were covered, including second and continuous wheats and after legumes, oilseed rape, potatoes and sugar beet.
The analysis clearly identified that the same total amount of nitrogen applied to all the trials would, in retrospect, have been the best predictive method of identifying the optimum economic dose on all soil types and rotational positions. It was by no means perfect in individual trials but overall it gave better financial returns than the other predictive methods of identifying the optimum economic dose, including RB 209.
This standard dose was the average economic optimum in these field trials. It sounds like cheating but this conclusion has subsequently been tested against trial results as they become available: the standard dose remains the best approach for predicting the economic optimum dose.
Obviously this standard dose needs to be adjusted according to the balance of nitrogen cost and grain price. NIAB TAG members received an excellent nitrogen overview at their recent winter meetings and are now receiving regular updates because of the current price variations of both nitrogen and grain.
This conclusion contrasts with the perceived wisdom adopted in RB 209 that every kg/ha of extra Soil Mineral Nitrogen (SMN), measured in the late winter/early spring, reduces the economic optimum dose of applied nitrogen by a kg/ha or more. The then NIAB TAG database contained trials held on sites with SMNs from just below 20 kg N/ha to just over 100 kg N/ha (equivalent to Soil Nitrogen Supply indices 0-3 in RB 209).
However, there was no relationship between optimum economic doses and these levels of SMN. When the scientific literature was consulted, it was impossible to find evidence that the range of SMNs at these levels influenced optimum doses.
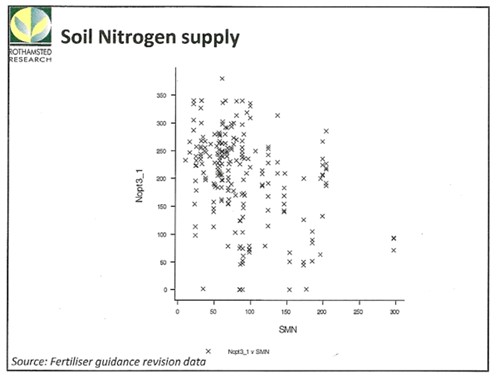
Hence it was no surprise that Rothamsted, when revising RB 209 in 2010, prepared a graph that demonstrated that there was no relationship between SMN levels up to 100 kg/ha N and optimum economic doses of nitrogen for feed wheat. It was a collation of all the field trials they had received including those from NIAB/TAG.
A cross in the graph marks the optimum economic dose of applied nitrogen in each individual trial where the price of a kg of nitrogen is three times that of a kg of feed wheat; a break-even ratio (BER) of 3:1 (happy days!). As you can also see, there is a shockingly high and chaotic variation in optimum doses at any given SMN.
More recently, AHDB research has confirmed that the standard dose approach is the most economic (Using farm experience to improve N management for wheat (LearN) | AHDB, Table 5, page 40) for feed wheat on long term arable mineral soils where soil amendments are not regularly used.
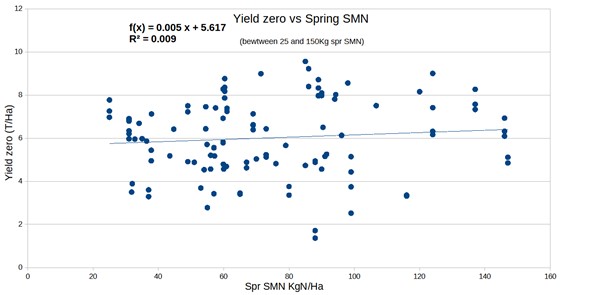
You would at least expect that the yield of feed wheat, without any applied nitrogen, would increase as SMN increases. However, analysis of a database of field trials carried out by several research organisations suggests not. Each dot in the following graph represents the yield with no applied N in an individual field trial.
There is no trend towards higher yields at zero applied nitrogen when SMN is below 100 kg N/ha, i.e. the slightly upward and statistically insignificant slope of the trend line is influenced totally by results from sites with a SMN above 100kg N/ha:
The description of these results as being “chaotic” seems appropriate when trying to make sense of the vast variation between sites when using SMN as the determinant of predicting optimum economic doses. Is there a possibility of restoring some order?
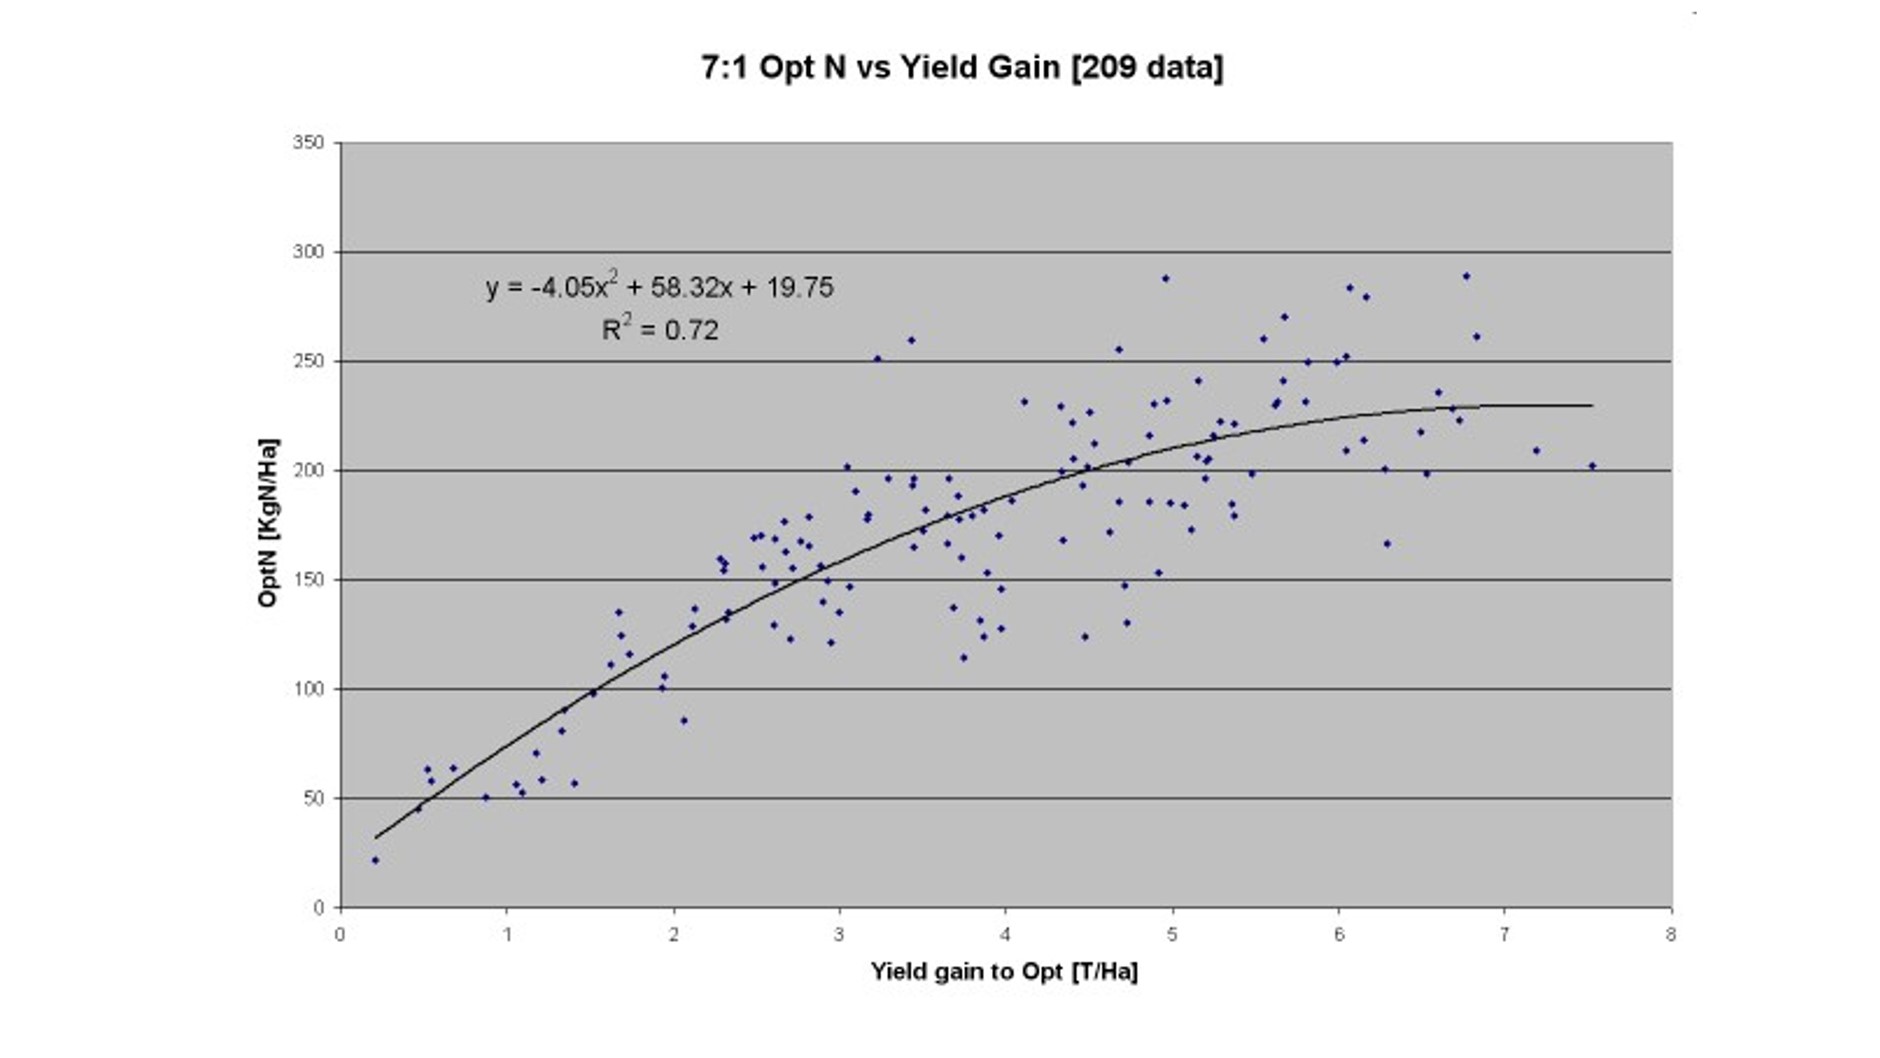
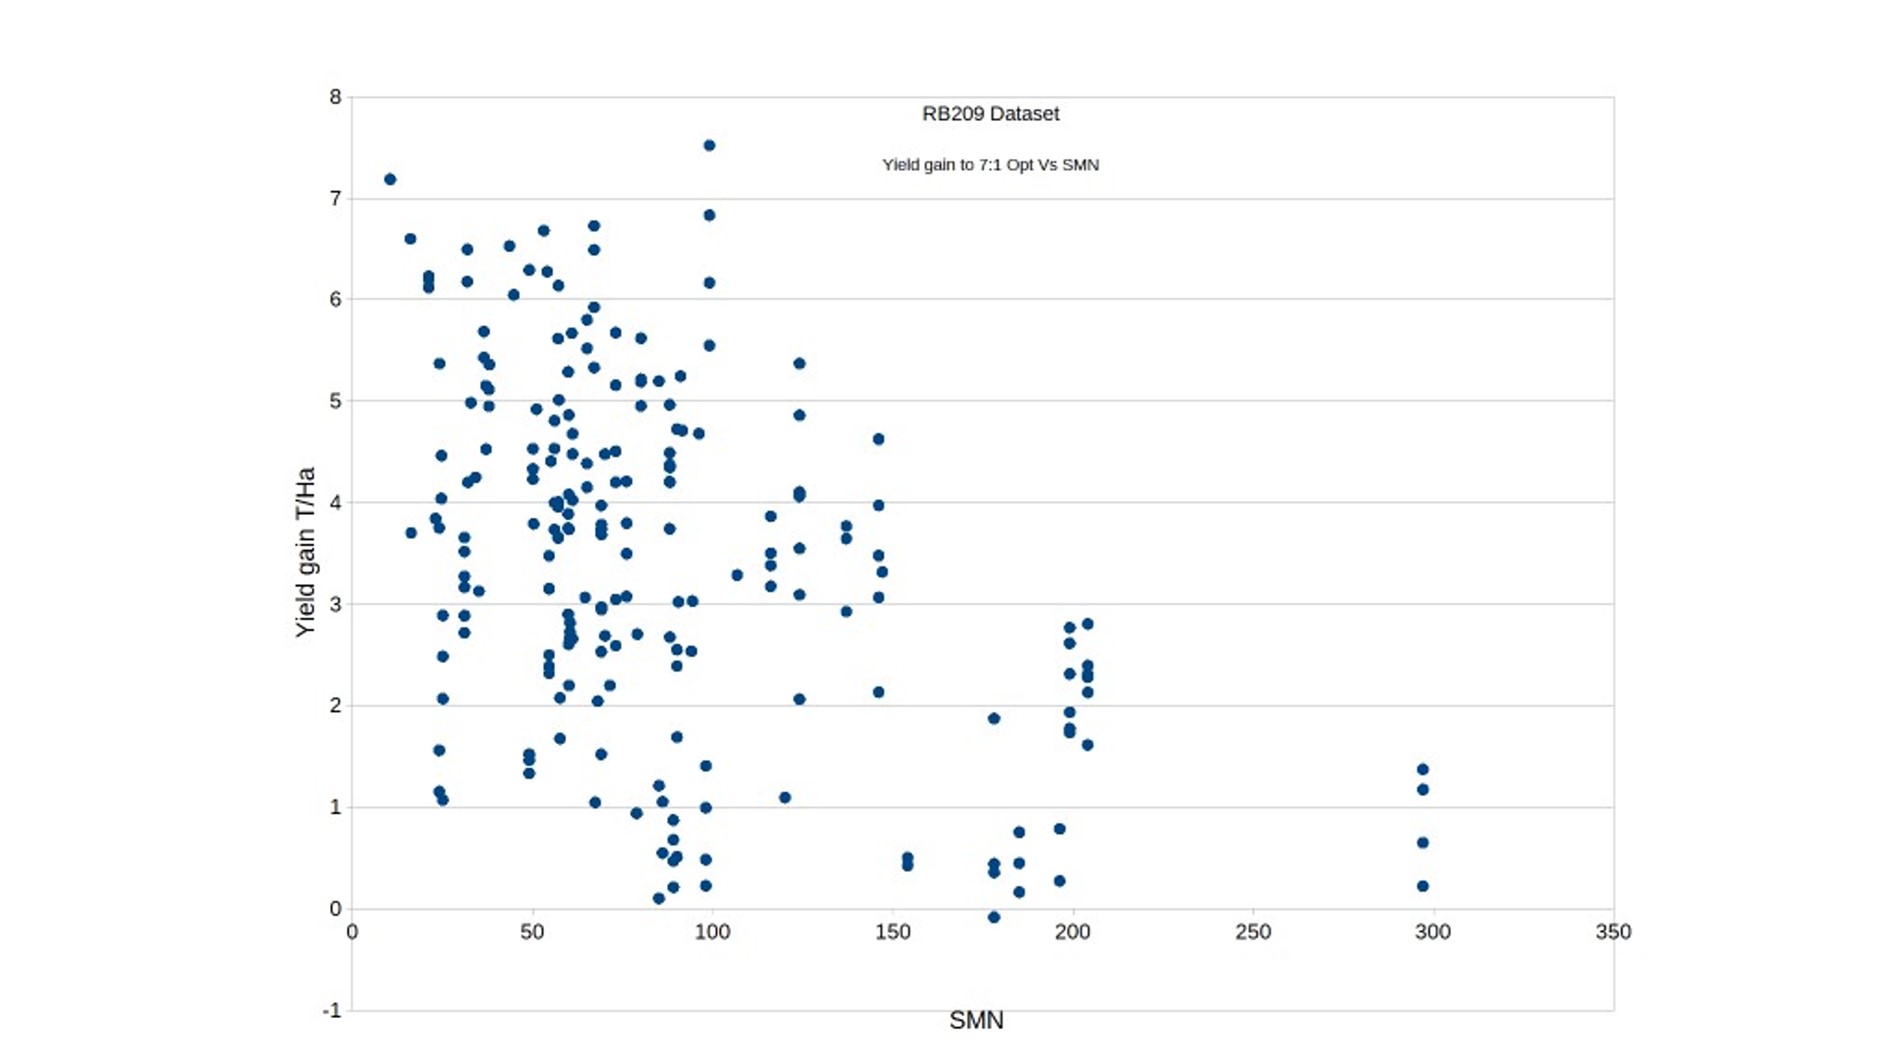
Indeed there is. There appears to be an extremely good relationship between the optimum economic dose (BER 7:1 in this case) and the yield gained from its application over and above the yield at zero applied nitrogen (the “Yield Gain”). Again, in the following graph each spot represents the results of an individual field trial.
In fact, the Yield Gain explains above two thirds of the variation in the economic optimum dose between trials. This is remarkable when you consider what is also going on over years between sites with a range of mineral soil types and differing rotational positions.
Perhaps, by now, it is now not surprising that SMN levels between 0 and 100 kg N/ha have no influence on yield gain (again at BER 7:1 in this case).
BUT using Yield Gain to predict economic optimum doses of applied nitrogen is not the breakthrough we may think. It does bring some order to chaos but how can you predict it for individual sites? Unfortunately, the weather conditions that influence much of the yield gain occur after the nitrogen is applied. Farmers could start trying to measure the level of yield they might achieve without applied nitrogen but this may vary between fields and years.
I may sound like a scientist when I say “more research is needed”. As an industry, we need to apply our thoughts to how to predict yield gain in individual fields. It may turn out to be impossible but surely it is worth a go. Until then, the standard dose approach is the most economic for feed wheat on mineral long-term arable soils, unless there are very high levels of SMN.